COLBE
The creation of localized current and future weather for the built environment
| Funder | UKRI - EPSRC |
| Website | Website |
| PI | Professor David Coley |
| CO-Is | Dr Sukumar Natarajan Dr Nick McCullen Dr Matthew Brown |
| Researchers | Dr Alfonso Ramallo-Gonzalez Dr Manuel Herrera Chunde Liu Daniel Fosas |
| Link | UKRI |
| Journal articles | (Herrera et al., 2017; Coley et al., 2017; Liu et al., 2017; Fosas et al., 2018; Ramallo-Gonzalez et al., 2020; Coley et al., 2023) |
| Conference papers | (Fosas et al., 2016; Herrera et al., 2018; Fosas et al., 2018; Ferreira et al., 2018) |
References
2023
-
 The Week That Will Be: Communicating the Impact of Climate Change via Extreme WeeksDavid A. Coley, Chunde Liu, and Daniel FosasBuilding and Environment, 2023
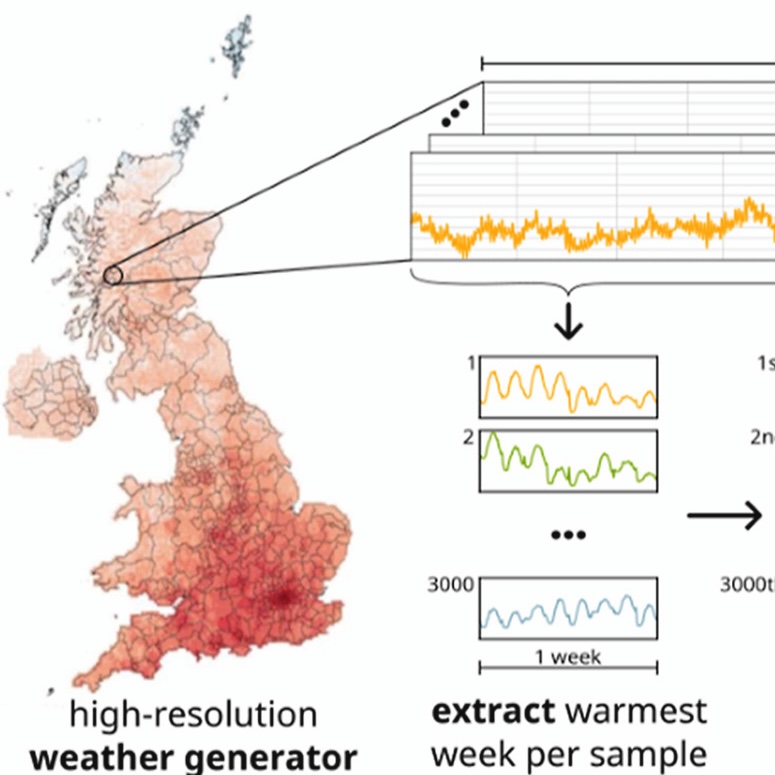
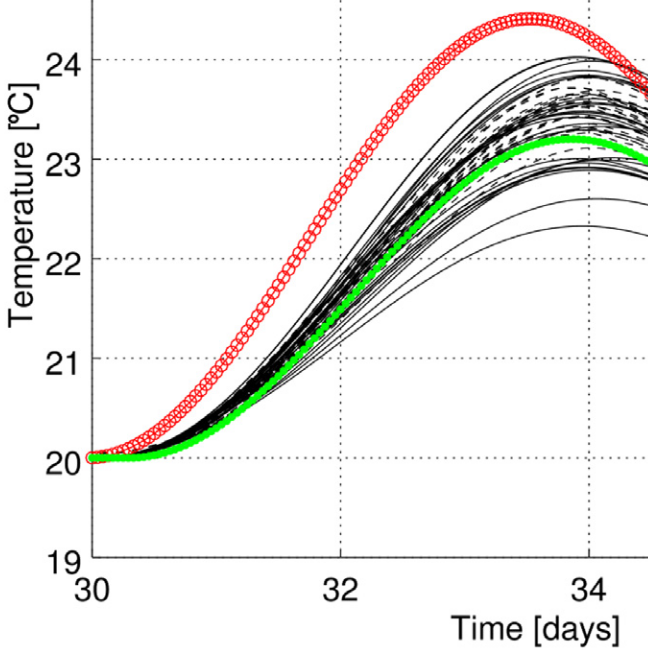
As events like the 2003 European heatwave showed (where 14,000 people died in Paris alone), it is in the extremes of weather, not the mean climate, where much climate change risk lies. Communication with the public, or the testing of natural and human-made environments via simulation, has focused however on the mean situation. To many, a future 2 or even 4 °C rise in mean temperature will seem modest and hence fail to convey the scale of the issue, thereby creating a gap between reality and expectation. Here we use the idea of presenting an audience with a week-long time series of future local extreme weather as a way of bridging this gap. A week has both vernacular currency and covers the length of many heatwaves. We generate UK future weeks in 2030, 2050 and 2080 at a 5 km interval, thereby allowing interested parties to visualise for the first time likely future heatwaves in their locality. Future heatwaves of similar form as the 2003 Paris event are found, but with even higher temperatures, suggesting the likelihood of largescale mortality. We apply the approach to the conditions within a UK home under future heatwaves with return periods of 10–50 years. Conditions far beyond adaptive comfort limits are found. Weather files containing the extreme weeks for 11,326 locations have been prepared and are made available. These will be of use to those trying to explain the likely impacts of climate change, governments setting resilience policy and those using computer modelling.
@article{coley2023week_that_will_be,
  title = {The Week That Will Be: Communicating the Impact of Climate Change via Extreme Weeks},
  author = {Coley, David A. and Liu, Chunde and Fosas, Daniel},
  year = {2023},
  journal = {Building and Environment},
  volume = {227},
  pages = {109809},
  issn = {0360-1323},
  doi = {10.1016/j.buildenv.2022.109809},
  url = {https://www.sciencedirect.com/science/article/pii/S0360132322010393},
}
2020
-
 An analytical heat wave definition based on the impact on buildings and occupantsAlfonso Ramallo-Gonzalez, Matt E. Eames, Sukumar Natarajan, and 2 more authorsEnergy & Buildings, 2020
Alongside a mean global rise in temperature, climate change predictions point to an increase in heat waves and an associated rise in heat-related mortality. This suggests a growing need to ensure buildings are resilient to such events. Unfortunately, there is no agreed way of doing this, and no standard set of heatwaves for scientists or engineers to use. In addition, in all cases, heat waves are defined in terms of external conditions, yet, as the Paris heat wave of 2003 showed, people die in the industrialised world from the conditions inside buildings, not those outside. In this work, we reverse engineer external temperature time series from monitored conditions within a representative set of buildings during a heat wave. This generates a general probabilistic analytical relationship between internal and external heatwaves and thereby a standard set of events for testing resilience. These heat waves are by their simplicity ideal for discussions between clients and designers, or for the setting of national building codes. In addition, they provide a new framework for the declaration of a health emergency.
@article{ramallo2020analytical,
  title = {An analytical heat wave definition based on the impact on buildings and occupants},
  volume = {216},
  journal = {Energy \& Buildings},
  author = {Ramallo-Gonzalez, Alfonso and Eames, Matt E. and Natarajan, Sukumar and Fosas, Daniel and Coley, David A.},
  year = {2020},
}
2018
-
 Mitigation versus Adaptation: Does Insulating Dwellings Increase Overheating Risk?Daniel Fosas, David A. Coley, Sukumar Natarajan, and 3 more authorsBuilding and Environment, 2018
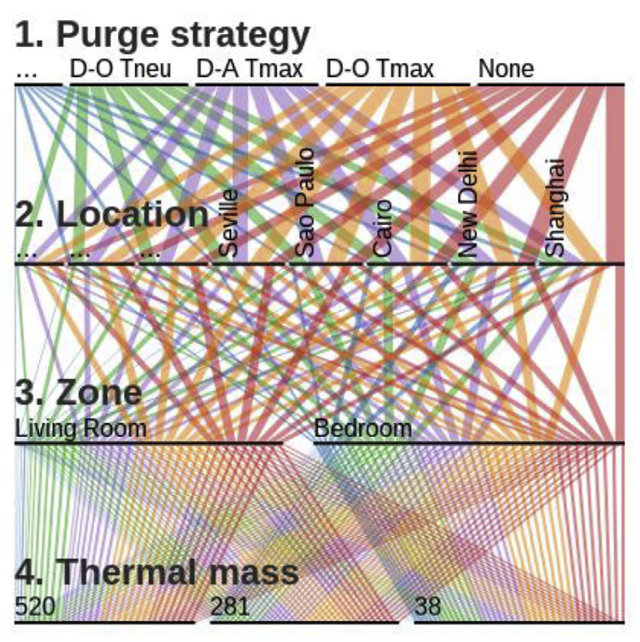
Given climate change predictions of a warmer world, there is growing concern that insulation-led improvements in building fabric aimed at reducing carbon emissions will exacerbate overheating. If true, this would seriously affect building regulations all over the world which have moved towards increased insulation regimes. Despite extensive research, the literature has failed to resolve the controversy of insulation performance, primarily due to varied scope and limited comparability of results. We approach this problem through carefully constructed pairwise comparisons designed to isolate the effect of insulation on overheating. We encompass the complete range of relevant variables: latitude, climate, insulation, thermal mass, glazing ratio, shading, occupancy, infiltration, ventilation, orientation, and thermal comfort models — creating 576,000 building variants. Data mining techniques are implemented in a novel framework to analyse this large dataset. To provide confidence, the modelling was validated against data collected from well-insulated dwellings. Our results demonstrate that all parameters have a significant impact on overheating risk. Although insulation is seen to both decrease and increase overheating, depending on the influence of other parameters, parameter ranking shows that insulation only accounts for up to 5% of overall overheating response. Indeed, in cases that are not already overheating through poor design, there is a strong overall tendency for increased insulation to reduce overheating. These results suggest that, in cases with acceptable overheating levels (below 3.7%), the use of improved insulation levels as part of a national climate change mitigation policy is not only sensible, but also helps deliver better indoor thermal environments.
@article{fosas2018mitigation, title = {Mitigation versus Adaptation: Does Insulating Dwellings Increase Overheating Risk?}, volume = {143}, journal = {Building and Environment}, year = {2018}, pages = {740--759}, author = {Fosas, Daniel and Coley, David A. and Natarajan, Sukumar and Herrera, Manuel and Fosas-de-Pando, Miguel Angel and Ramallo-Gonzalez, Alfonso}, } -
 Enhancing Predictive Models for Short-Term Forecasting Electricity Consumption in Smart BuildingsManuel Herrera, Daniel Fosas, Bruno M. Beltran, and 1 more authorIn 1st International Conference on Data for Low Energy Buildings, Murcia, 2018
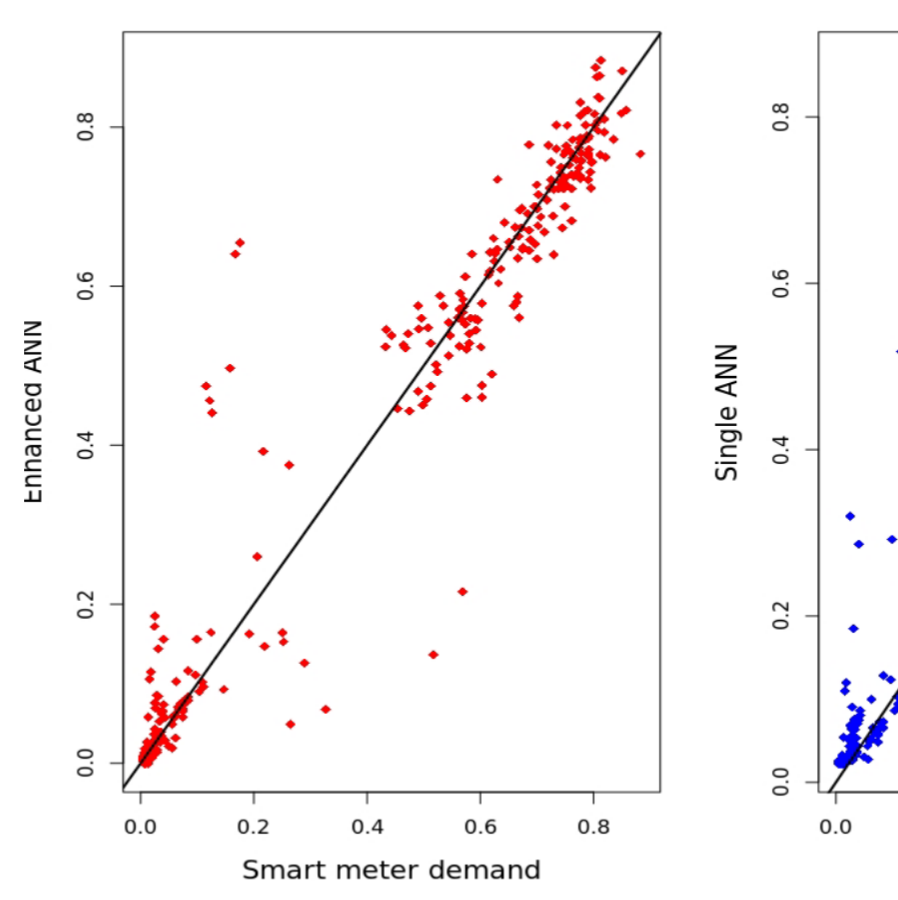
Lighting, heating, and air conditioning systems are instances of how electricity use at buildings is of key importance for occupants comfort and well-being. Since the electricity can be produced but cannot be stored, for utility companies it is important to reliably forecast energy supply almost in near real-time. Nowadays, smart grid technologies development also require a high resolution forecasting to eliminate blackouts and to optimally adapt energy supply to customers’ needs. These are the reasons why the finest Machine Learning and Data Science based methods have been developed and applied to approach as much accurate as possible predictive models for short-term electricity consumption. This paper proposes to enhance those predictive models by using weather and calendar information to configure a more complete working database. In addition, a cluster-based forecasting methodology will augment any predictive model with learning from other buildings. Thus, predicting future values for one smart meter is approached by utilising not only its own historical electricity consumption values, but working with a multivariate time series on weather and calendar data and information from other buildings at the same cluster. This proposal has been tested with measures from smart meters collected every 30 minutes during one year for 5 selected buildings in Bristol (UK). The enhancing methodology can predict electricity consumption data with higher accuracy than using data from just one building.
@inproceedings{herrera2018enhancingpredictivemodels, location = {Murcia}, title = {Enhancing Predictive Models for Short-Term Forecasting Electricity Consumption in Smart Buildings}, eventtitle = {1st International Conference on Data for Low Energy Buildings}, booktitle = {1st International Conference on Data for Low Energy Buildings}, publisher = {University of Murcia}, year = {2018}, author = {Herrera, Manuel and Fosas, Daniel and Beltran, Bruno M. and Coley, David A}, } -
 Weather Files for Remote Places: Leveraging Reanalyses and Satellite DatasetsDaniel Fosas, Manuel Herrera, Sukumar Natarajan, and 1 more authorIn 1st International Conference on Data for Low Energy Buildings, Murcia, 2018
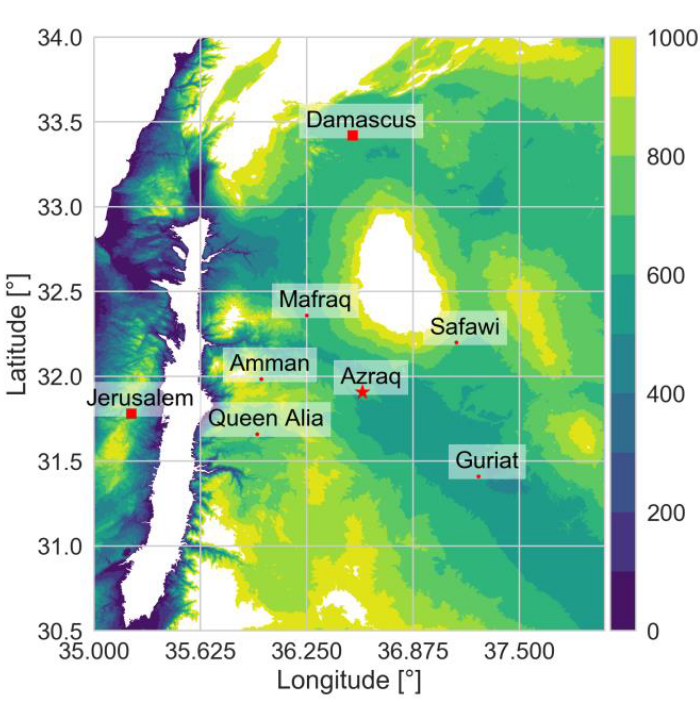
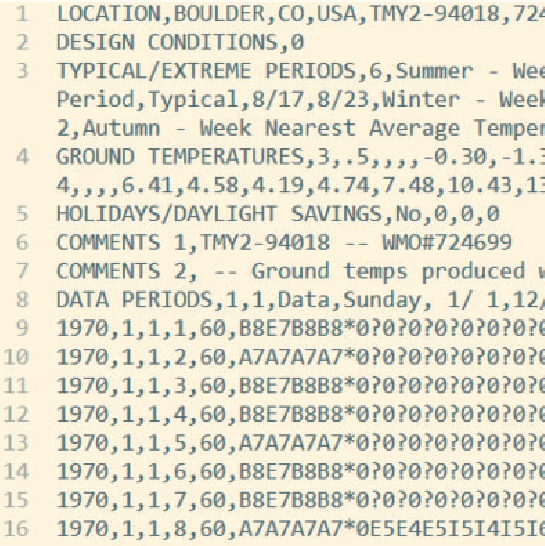
Weather files capture the time-varying conditions under which buildings perform and, as such, they constitute one of the fundamental inputs for building performance simulation. In theory, the creation of weather files only requires collecting data at a certain frequency for a key number of variables during the time of interest. In practice, several problems arise. Direct measurement on a project basis can be a costly operation considering the site accessibility and the number of instruments needed to collect complete weather observations. Sometimes, this is simply impossible if a study requires historical data. These issues are traditionally overcome using the weather data collected at a nearby public weather stations, but this can be equally challenging, or even impossible, depending on how far away the station is and the frequency and completeness of observations. Arising from the need to simulate the thermal performance of buildings at remote locations, this study presents an approach to generate weather files based on satellite imaging and reanalysis datasets. Given the good agreement with local station’s observations, it is shown how these publicly available datasets can be combined to create weather files suitable for building performance simulation. This is applied to a case study to compare the performance of a building and its systems against traditional weather files. The work quantifies and discusses the discrepancy obtained between the different sources. Overall, results indicate that satellite and reanalysis datasets constitute a suitable resource to create weather files for building performance simulation.
@inproceedings{fosas2018weatherfilesremote, location = {Murcia}, title = {Weather Files for Remote Places: Leveraging Reanalyses and Satellite Datasets}, eventtitle = {1st International Conference on Data for Low Energy Buildings}, booktitle = {1st International Conference on Data for Low Energy Buildings}, publisher = {University of Murcia}, year = {2018}, author = {Fosas, Daniel and Herrera, Manuel and Natarajan, Sukumar and Coley, David A}, } -
 Adaptive Piecewise and Symbolic Aggregate Approximation as an Improved Representation Method for Heat Waves DetectionAida Ferreira, Iona Rameh Barbosa, Ronaldo Aquino, and 4 more authorsIn Intelligent Computing, London, 2018
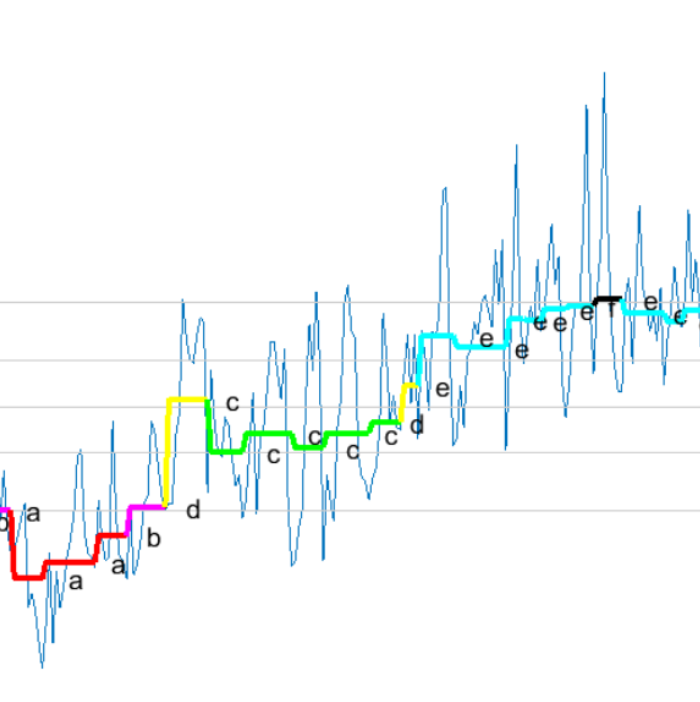
Mining time series has attracted an increasing interest due to its wide applications in finance, industry, biology, environment, and so on. In order to reduce execution time and storage space, many high level representations or abstractions of the raw time series data have been proposed including Discrete Fourier Transform (DFT), Discrete Wavelet Transform (DWT), Piecewise Aggregate Approximation (PAA) and Symbolic Aggregate approXimation (SAX). In this paper, we introduce a novel adaptive piecewise and symbolic aggregate approximation (APAA/ASAX) which creates segments of variable length in order to automatically adapts any segment length to its local condition of variability and difference to the average value of the current values in which the segment is defined. The average of each variable segment length from APAA is represented as a symbol from an ordered alphabet generating a modified version for SAX called adaptive SAX (ASAX). This straightforwardly allows to handle a more versatile definition for the event duration. The method APAA/ASAX was used for locating heat waves patterns in a realworld time series datasets of daily temperature information, from the year 1970 until 2009. The experimental results show that APAA/ASAX representation was able to locate heatwave events in a huge databases. Advantages of APAA regarding traditional PAA are mainly based on being constrain-free of fixed schemes of segment length. It also highlights the ability of self-tuning this length depending on local time series characteristics. This means that for flat time series APAA proposes a lower number of segments to reduce dimensionality than in the case to deal with time series of high variability. The approach will be of use to those looking extreme events in any time series.
@inproceedings{ferreira2018adaptivepiecewisesymbolic,
  location = {London},
  title = {Adaptive Piecewise and Symbolic Aggregate Approximation as an Improved Representation Method for Heat Waves Detection},
  booktitle = {Intelligent Computing},
  year = {2018},
  author = {Ferreira, Aida and Rameh Barbosa, Iona and Aquino, Ronaldo and Herrera, Manuel and Natarajan, Sukumar and Fosas, Daniel and Coley, David},
}
2017
-
 A review of current and future weather data for building simulationManuel Herrera, Sukumar Natarajan, David A. Coley, and 5 more authorsBuilding Services Engineering Research and Technology, 2017
This article provides the first comprehensive assessment of methods for the creation of weather variables for use in building simulation. We undertake a critical analysis of the fundamental issues and limitations of each methodology and discusses new challenges, such as how to deal with uncertainty, the urban heat island, climate change and extreme events. Proposals for the next generation of weather files for building simulation are made based on this analysis. A seven-point list of requirements for weather files is introduced and the state-of-the-art compared to this via a mapping exercise. It is found that there are various issues with all current and suggested approaches, but the two areas most requiring attention are the production of weather files for the urban landscape and files specifically designed to test buildings against the criteria of morbidity, mortality and building services system failure
@article{herrera2017review, title = {A review of current and future weather data for building simulation}, author = {Herrera, Manuel and Natarajan, Sukumar and Coley, David A. and Kershaw, Tristan and Ramallo-González, Alfonso P. and Eames, Matt and Fosas, Daniel and Wood, Mike}, journal = {Building Services Engineering Research and Technology}, volume = {38}, pages = {602--627}, year = {2017}, } -
 Probabilistic adaptive thermal comfort for resilient designDavid A. Coley, Manuel Herrera, Daniel Fosas, and 2 more authorsBuilding and Environment, 2017
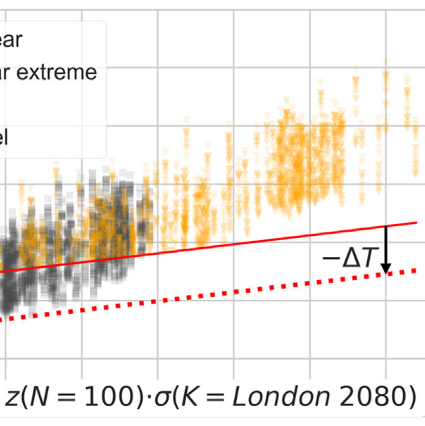
Adaptive thermal comfort theory has become the bedrock of much thinking about how to judge if a free-running environment is suitable for human occupation. In design work, the conditions predicted by a thermal model, when the model is presented with one possible annual weather time series (a reference year), are compared to the limits of human comfort. If the temperatures are within the comfort limits, the building is judged to be suitable. However, the weather in many locations can vary year-on-year by a considerable margin, and this begs the question, how robust are the predictions of adaptive comfort theory likely to be over the many years a building might be in use? We answer this question using weather data recorded for up to 30 years for locations within each of the five major Köppen climate classifications. We find that the variation in the annual time series is so great that the predicted comfort temperature frequently lies outside the acceptable range given by the reference year. Return periods for the excursions of the time series are calculated for each location. The results for one location are then validated using the world’s longest temperature record. These results suggest that industry and academia would be best advised to move to a probabilistic methodology, like the proposed one, when using adaptive comfort theory to judge the likely conditions within a building. Extra pertinence is provided by concerns over increases in mortality and morbidity in buildings due to a rapidly warming climate.
@article{coley2017probabilistic, title = {Probabilistic adaptive thermal comfort for resilient design}, journal = {Building and Environment}, volume = {123}, pages = {109--118}, year = {2017}, author = {Coley, David A. and Herrera, Manuel and Fosas, Daniel and Liu, Chunde and Vellei, Marika}, } -
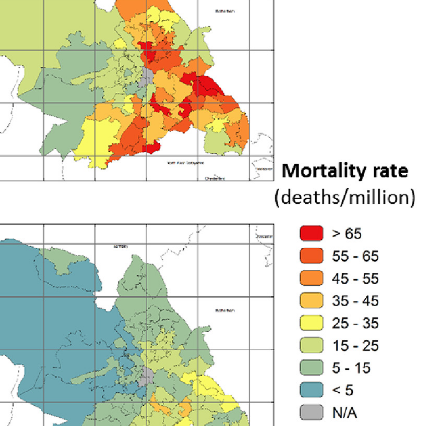 High resolution mapping of overheating and mortality riskChunde Liu, Tristan Kershaw, Daniel Fosas, and 3 more authorsBuilding and Environment, 2017
Both the Paris heat wave of 2003 and recent high-resolution climate change predictions indicate a world where mortality from extreme weather events will increase. Most heat wave deaths occur in buildings, and are driven by the thermal characteristics of the buildings and their local environment. Unfortunately previous work on the topic has ignored such spatial variations by either assuming the climate has little variation over a large area, or using archetypes of buildings from stock models. The latter forgetting that neither building characteristics nor landscape context are uniform over a city, with for example suburbs having a different architecture and shading to the inner city. In this work we use a statistical method combined with a new remote surveying tool to assemble accurate models of real buildings across a landscape then map the spatial variability in overheating and excess deaths now and in the future at a resolution of 5km x 5km. High spatial variation in the risk of overheating and heat-related mortality was found due to the variability of architecture, context and weather. Variability from the architecture and shading context were found to be a greater influence on the spatial variation in overheating than climate variability. Overheating risk was found to increase significantly with heat-related mortality tripling by the 2050s. The method was validated against data collected during the northern hemisphere 2006 hot summer. The maps produced would be a highly useful resource for government in identifying populations of greatest concern when developing policies to combat such deaths.
@article{liu2017high,
  title = {High resolution mapping of overheating and mortality risk},
  volume = {122},
  pages = {1--14},
  journal = {Building and Environment},
  author = {Liu, Chunde and Kershaw, Tristan and Fosas, Daniel and Ramallo Gonzalez, Alfonso P. and Natarajan, Sukumar and Coley, David A.},
  year = {2017},
}
2016
-
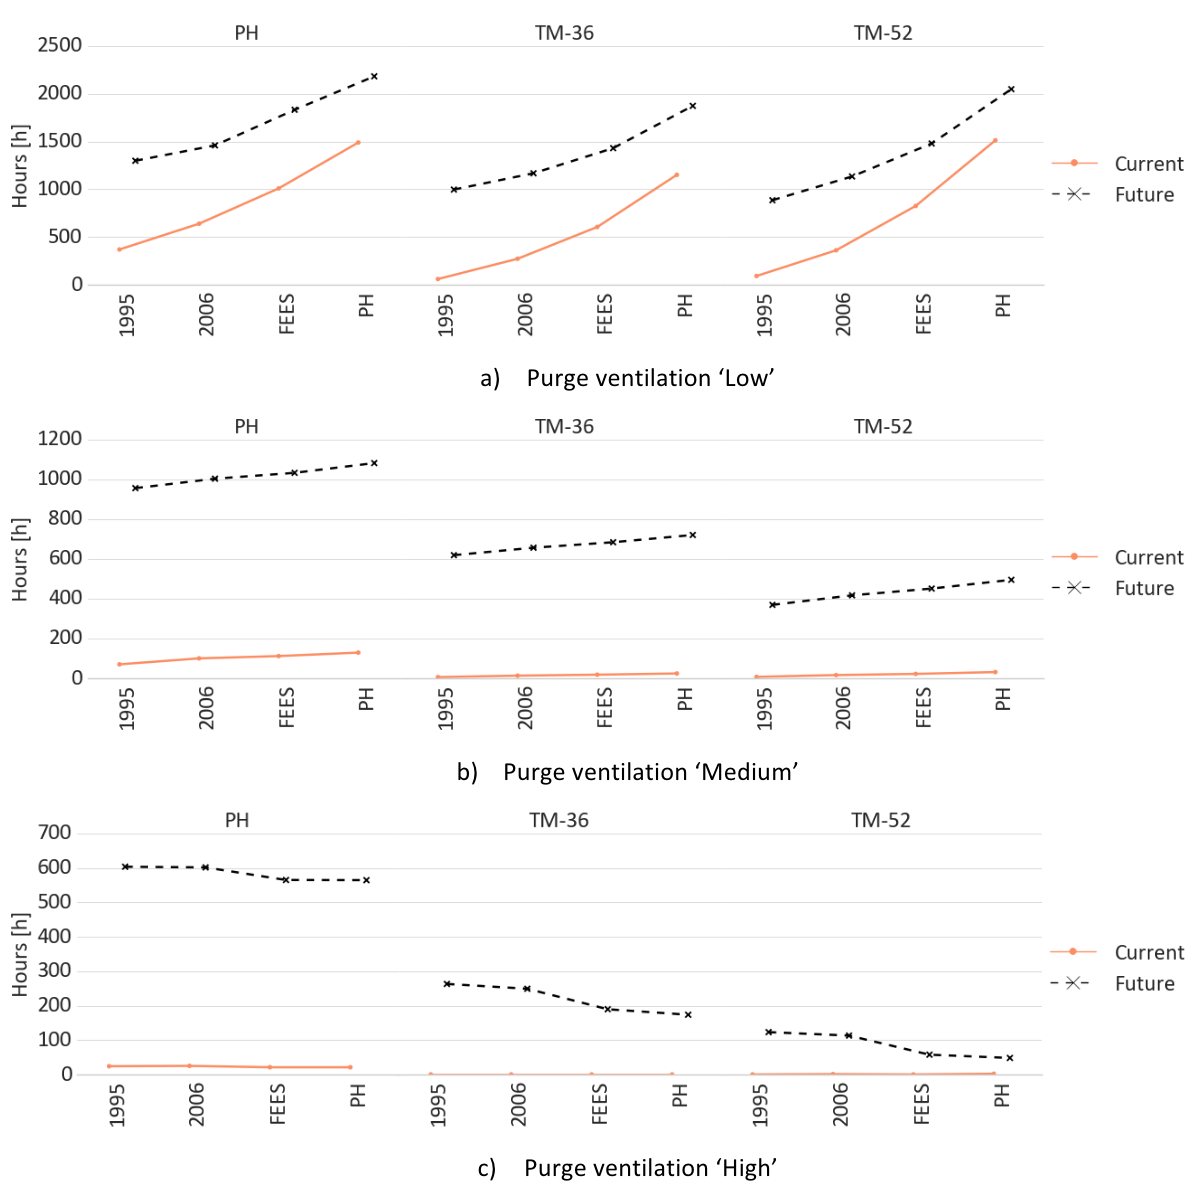 Influence of overheating criteria in the appraisal of building fabric performanceDaniel Fosas, Sukumar Natarajan, David A. Coley, and 2 more authorsIn 9th Windsor Conference: Making Comfort Relevant, Windsor, 2016
In response to the threat of anthropogenic climate change, heating dominated countries have focused on reducing the space conditioning demand by increasing insulation and airtightness. However, given climate projections and lifespan of buildings, concerns have arisen on whether these strategies deliver resilient solutions. As overheating can be evaluated through different criteria, this paper investigates if building fabric performance is subject to bias from the assessment method chosen and account for discrepancies between previous studies. To answer this, we modelled dwellings compliant with 1995 and 2006 UK building regulations and the FEES and Passivhaus standards in a consistent and realistic manner. The parametric study included different weathers, thermal mass, glazing ratios, shading strategies, occupancy profiles, infiltration levels, purge ventilation strategies and orientations, resulting in 16128 simulation models. To provide confidence in the output, the base model was first validated against data collected from a real well-insulated dwelling. Results show that the benchmark choice is influential in the evaluation of building fabric performance as it is able to inverse overheating trends. Criteria based on adaptive comfort best represented expected behaviour, where improved building fabric is a resilient measure that reduces overheating as long as occupants are able to open windows for ventilation.
@inproceedings{fosas2016influence,
  location = {Windsor},
  title = {Influence of overheating criteria in the appraisal of
                    building fabric performance},
  author = {Fosas, Daniel and Natarajan, Sukumar and Coley, David A. and Ramallo-González, Alfonso P. and Fosas de Pando, Miguel},
  booktitle = {9th Windsor Conference: Making Comfort Relevant},
  pages = {1078--1098},
  year = {2016},
  organization = {NCEUB},
}